

Using Stocktwits to understand Investor Sentiment
Using Stocktwits to understand Investor Sentiment

Introduction
Stocktwits is advertised as a social media channel for traders. On their website, you can search by ticker to see comments from different accounts along with an associated direction - Bullish, Bearish or Neutral. Just above each chart is a sentiment value, which takes the number of bullish and bearish messages or “twits” per day and aggregates them into a single metric.
I have some personal issues with this metric. The main one is that it doesn’t take into account who the user is. Anyone can make an account on Stocktwits and post opinions on whatever ticker they want to. That’s not to say that they will definitely be wrong, but there might be some users opinions that you would like to give more significance to than others.
I decided to design my own metric. It’s simple, and it is slightly limited in its ability due to the fact that the Stocktwits API only allows me to grab the 30 most recent messages, but this is a framework that can be easily scaled with more data and has the potential to give us a clearer image on sentiment than the Stocktwits metric provides.
Methodology
So how do we create a metric that gives credit to what we believe to be the more “informed” traders? By far the easiest method is to weight each message by the number of followers that user has. We assume that a user with a successful history in their opinions will have garnered a following, since other users will have observed this and responded by following their account. As a user continues to provide more useful insights, we expect his followers to grow and so therefore so will their importance in our algorithm.
The Stocktwits API is free and doesn’t require any authentication. It allows you to access the 30 most recent messages from users in relation to a symbol that we provide. The first section of my code pulls in EURUSD messages and cycles through the JSON file returned, to present us with a dataframe containing 3 columns, the date of message, the number of followers the user has and the sentiment value the user assigns (bullish, bearish or neutral).
#Import required dependencies
import pandas as pd
import numpy as np
import requests
import json
import warnings
warnings.filterwarnings('ignore')

#Pull JSON data
symbol = 'EURUSD'
url = 'https://api.stocktwits.com/api/2/streams/symbol/{}.json'.format(symbol)
data = requests.get(url).json()

#Loop through and add elements to dataframe
df = pd.DataFrame()
for i in range(0,len(data['messages'])):
    json_entry = data['messages'][i]
    followers = json_entry['user']['followers']
    try:
        sentiment = json_entry['entities']['sentiment']['basic']
    except:
        sentiment = 'None'
    date_created = json_entry['created_at']
    row = np.asarray([date_created,followers,sentiment])
    row_df = pd.DataFrame(columns = ['Date Created','Followers','Sentiment'])
    df = df.append(pd.DataFrame(row).T)

#Misc - Tidy up df, rename cols, change data types
df = df.rename(columns = {0:'Date Created',1:'Followers',2:'Sentiment'})
df['Sentiment Value'] = df['Sentiment'].replace({'Bullish':1,'None':0,'Bearish':-1})
df['Followers'] = df['Followers'].astype(np.int32)
df['Date Created'] = pd.to_datetime(df['Date Created'])
df = df.reset_index().drop(['index'],axis = 1)
The next step is to calculate our metric. We’ve converted the sentiment into numerical figures to determine how they affect our value, so a bearish sentiment will be assigned -1, a bullish sentiment will be assigned +1 and neutral will be assigned 0. Our metric will return a value between -1 and 1 and is calculated by multiplying the followers column by the sentiment column and then dividing this by the sum of the followers column.
I noticed very quickly that the abundance of “neutral” messages was diluting my sentiment metric quite heavily. All it takes is for the user with the most followers to be neutral and our metric will be very close to 0 and won’t give us a good indication of sentiment. My solution was to remove the neutral messages altogether. This is the same strategy that Stocktwits themselves use, ignoring any neutral messages and aggregating purely the bullish and bearish ones.
shortened_df = df[df['Sentiment Value'].isin([1,-1])]
#shortened_df = df
metric = (shortened_df['Followers'] * shortened_df['Sentiment Value']).sum()/shortened_df['Followers'].sum()
print('Sentiment Metric = {}'.format(round(metric,5)))
There is an optional modification to this metric that I have also found to be quite useful. Similar to the issue that I observed with the neutral messages, our sentiment metric can be heavily influenced by one user if his follower count is significantly higher than all the others. Ideally we don’t want this to happen, a highly followed user should be weighted as such, but not to the point that they comprise 90% of our entire metric.
The solution is to assign our followers to one of three groups, each of which represents a 33% segment of the user with the most followers. We then use the follower group as our weightage, as opposed to the actual number of followers the user has.
#Calculating the alternate sentiment metric
lower = shortened_df['Followers'].max()*0.33
upper = shortened_df['Followers'].max()*0.66

for i,r in shortened_df.iterrows():
    if r['Followers'] < lower:
        shortened_df.loc[i,'Follower Group'] = 1
    elif r['Followers'] >= lower and r['Followers'] <= upper:
        shortened_df.loc[i,'Follower Group'] = 2
    else:
        shortened_df.loc[i,'Follower Group'] = 3

alt_metric = (shortened_df['Follower Group'] * shortened_df['Sentiment Value']).sum() / shortened_df['Follower Group'].sum()

print('Alternate Sentiment Metric = {}'.format (round(alt_metric,5)))
There are a many ramifications I could make to this model and will look to do so in the future. Whilst the API is quite limited, there is the possibility of getting more data if we build a scraper to take the information directly from the Stocktwits website. A similar process could be done through Twitter, where we search by hashtags and use some form of Natural Language Processing to gauge the sentiment of the tweet and then weight by followers. The potential issue we run into with Twitter however, is that its purpose is far more than simply posting trading ideas and as such, our follower count may be skewed. An occasional trader may have thousands of followers due to other content that they provide and so to give them a high weightage in our model would be inaccurate.
In a few upcoming articles, I’m going to take a closer look at Natural Language Processing, because the ability to build a model that analyses text and reports sentiment gives us another level of market confidence, that could potentially be far more accurate in mirroring the markets. In the meantime, I will leave you with the following table of Stocktwits sentiment for a collection of significant assets, from the code I ran yesterday evening at 22:00 GMT.
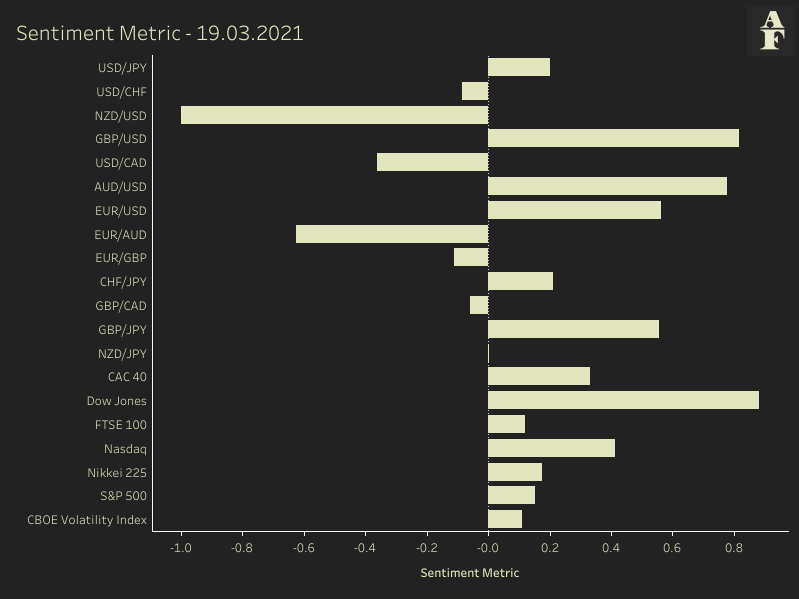
The dashboard can also be accessed on my Tableau Public.